Geostorms and Physical Reactions
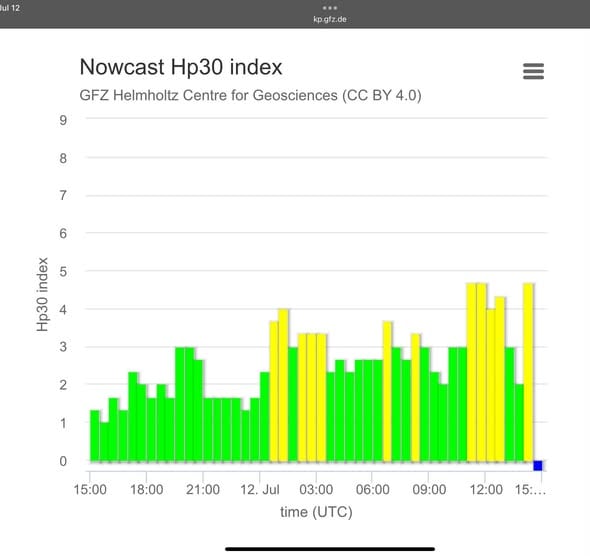 Yesterday, there was a very mild geostorm from a CME. The hp30 didn’t go above 5, which is the threshold many of my clients have for having liver, lymph, kidney and colon regulation shut down, yet some of them still did.
If these systems lose autonomic regulation, endogenous toxins build up in the body, leading to symptoms, plus heart regulation can be directly affected, which is what leads to the heart attack risk known to correlate with geostorms.
The Kp and Hp indexes are global averages, taken from several stations. This means there can be localized effects that are quite different from what these charts suggest, with higher latitudes being much higher than mid latitudes.
To describe what’s happening more precisely, there are 2 measurements of different things that can affect the body:
• The swings (rate/magnitude of change within a window) — Kp or Hp is capturing how much and how fast the magnetic field changed during a 3-hour block or a 30 minute block, respectively. The body’s autonomic/vagal response to a changing field is more tied to the rate of change than to a static field strength, similar to how sudden pressure or temperature shifts trigger a stronger physiological response than the same total change spread out slowly (The first chart shows the Hp30 for yesterday and the 3rd chart shows the field strength swings in nano Teslas).
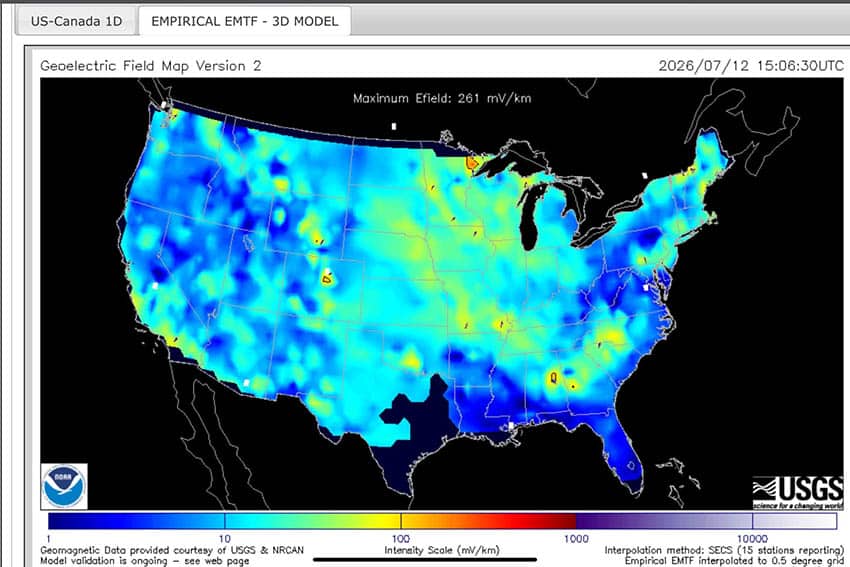
• The total geoelectric field (mV/km) — this is closer to what would actually drive induced current at a given location, which is a more direct physical mechanism for tissue-level effects (induced currents affecting nerve conduction, membrane potentials, etc.) (The second map image).
 Tracking both of these can help see correlations with symptoms.
There is a map that shows the geoelectric field strength for North America. If you’re in the USA, there’s a more refined map that you can check to see if your area is being impacted more than the charts show, or even more than the regional North American map shows. Note that while there are some areas that often have a higher geoelectric level on the map quite commonly due to geological conductivity, it also varies enough from storm to storm that it’s a good idea to check this.
If you live outside of this region or are wondering if you are in a smaller area of high conductivity than this map shows, you can use a body voltage meter for this. I can guide you on where to get one.
I don’t post when these milder storms are occurring, but I do contact my more sensitive clients to let them know to adjust their protocol according to what we’ve found works to keep their autonomic regulation open and endogenous toxins flowing out of the body.
If you notice you don’t feel well on these mild storm days, you may want to monitor the storm through the map (if you’re in the USA) and the Hp30 and make your own adjustments to keep these endogenous toxins flowing. I’ve found in my ART testing of clients that an individualized placement and frequency of vagus nerve stimulation works instantly to correct this (the ear placements that are most common don’t.)